Depending on the loaded dataset, the portal shows maps of genes and samples. Selections in one plot are reflected in linked plots. For more information, please watch the tutorial videos and/or read the publication (submitted):
BrainScope: interactive visual exploration of the spatial and temporal human brain transcriptome Sjoerd M.H. Huisman, Baldur van Lew, Ahmed Mahfouz, Nicola Pezzotti, Thomas Höllt, Lieke Michielsen, Anna Vilanova, Marcel J.T. Reinders, Boudewijn P.F. Lelieveldt
Brainscope uses some of the most recent HTML5 and WebGL browser technology. As a result we do not support older browser versions. Currently (2016/11) we are testing with these browser versions:
- Firefox 49
- Safari 9.1
- Chrome 54.0
- Vivaldi 1.5*
It is essential that the combination of browser and graphics card is sufficient to support WebGL 1. To test this see the following link WebGL Report. You should see This browser supports WebGL 1 at the top of the report. If there are still issues then contact us (see "How do we contact the authors?" item in the FAQ).
Brainscope offers two ways to combine selections. The first is suitable for quick and simple combination of preexisting gene groups
- Make the selections you wish to combine - and have one of them displayed (here Genes_0)

- Control click a second selection (here Genes_1) to add it to the first (producing Genes_0/Genes_1)

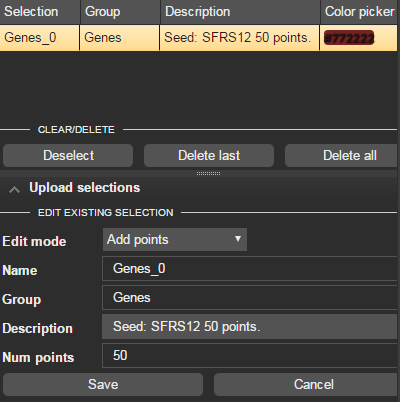
The second method exploits the selection edition options
- Take an existing selection and right click

- Choose the edit option

- Within edit select the Add points mode to add more plot points to the group
- Select more points using mouse over, drawing or property based selection.
- Click Save to complete the editing
Included directly:
| Library (click for original license) | License type |
|---|---|
| pixi.js V3.07 | MIT |
| jQuery v1.11.3 | MIT |
| Bootstrap v3.3.4 | MIT |
| webix 2.4.7 | GPL with FOSS exception |
| kdTree by Ubilabs | MIT |
Included via browserify bundle:
| Library (click for original license) | License type |
|---|---|
| ndarray | MIT |
| ndarray-ops | MIT |
| nrrd-js | MIT |
| tinycolor2 v1.4.1 | MIT |
| JSONPath Plus 0.15.0 | MIT |
| file-saver | MIT |
| clipboard | MIT |
The techniques to display the large interactive plots are not specific to plotting gene clusters. The code has been (largely) designed with this in mind. After some refactoring a separate version of the library will be released to allow reuse under an open source license. When it becomes available we will report it here.